This tutorial is to help new users get accustomed to the Dashboard and its elements. It would cover the elements on the dashboard and self-generated graphs for activity tracking. Navigating the dashboard is swift and easy.
Topics Covered
This guide covers navigating the Labellerr dashboard:
- Dashboard Overview - Your home screen and main navigation hub
- Status Bar Elements - Real-time annotation progress tracking
- Self-Generated Graphs - Activity tracking and progress visualization
- Quick Actions - Accessing projects and tasks efficiently
Status bar Elements
The Status bar displays Annotation progress in real-time and helps keep track of the user activity. The most important elements are the Total files, Accepted, remaining, and Percentage completion. This automatically updates itself when new files are added to the project.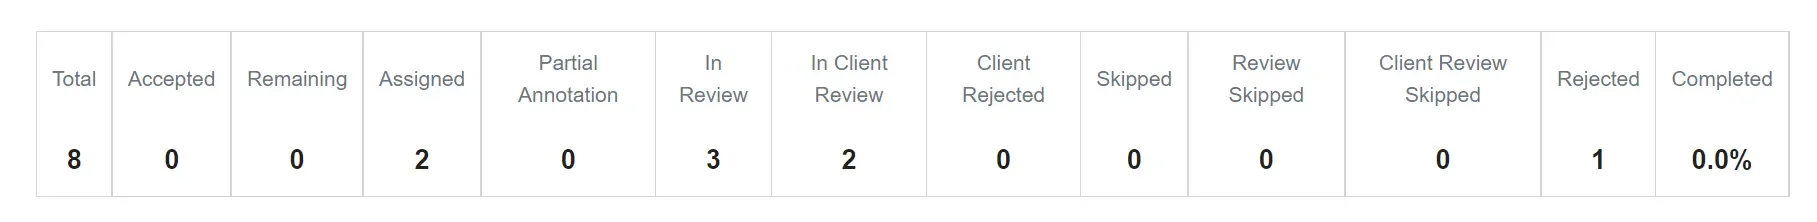
Self Generated Graphs
These are the four self-generated graphs:1
Labelling Trends
Labelling Trends: Shows the trends of a specific time period and status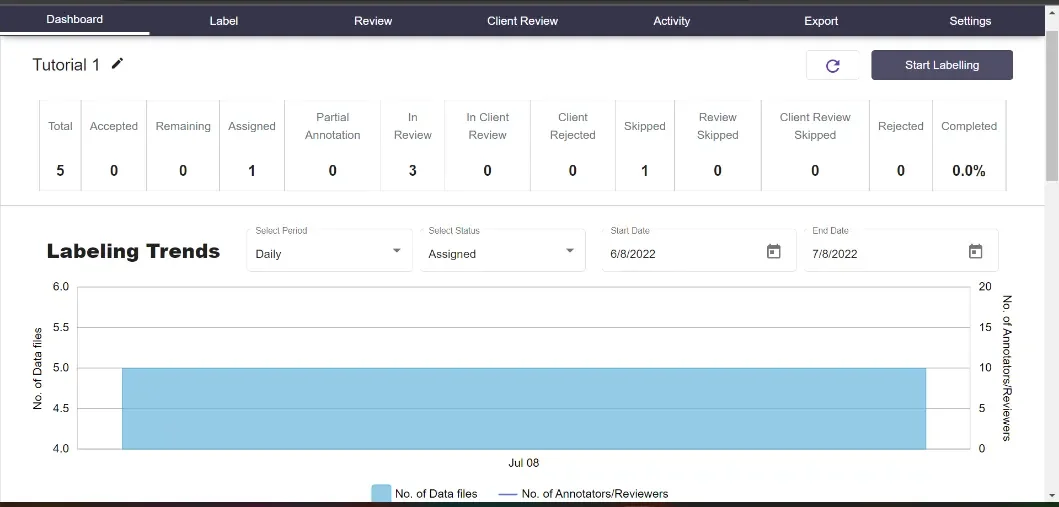
2
Label Distribution
Label Distribution: Here the labelling trends are seen. Individual objects can also be selected for screening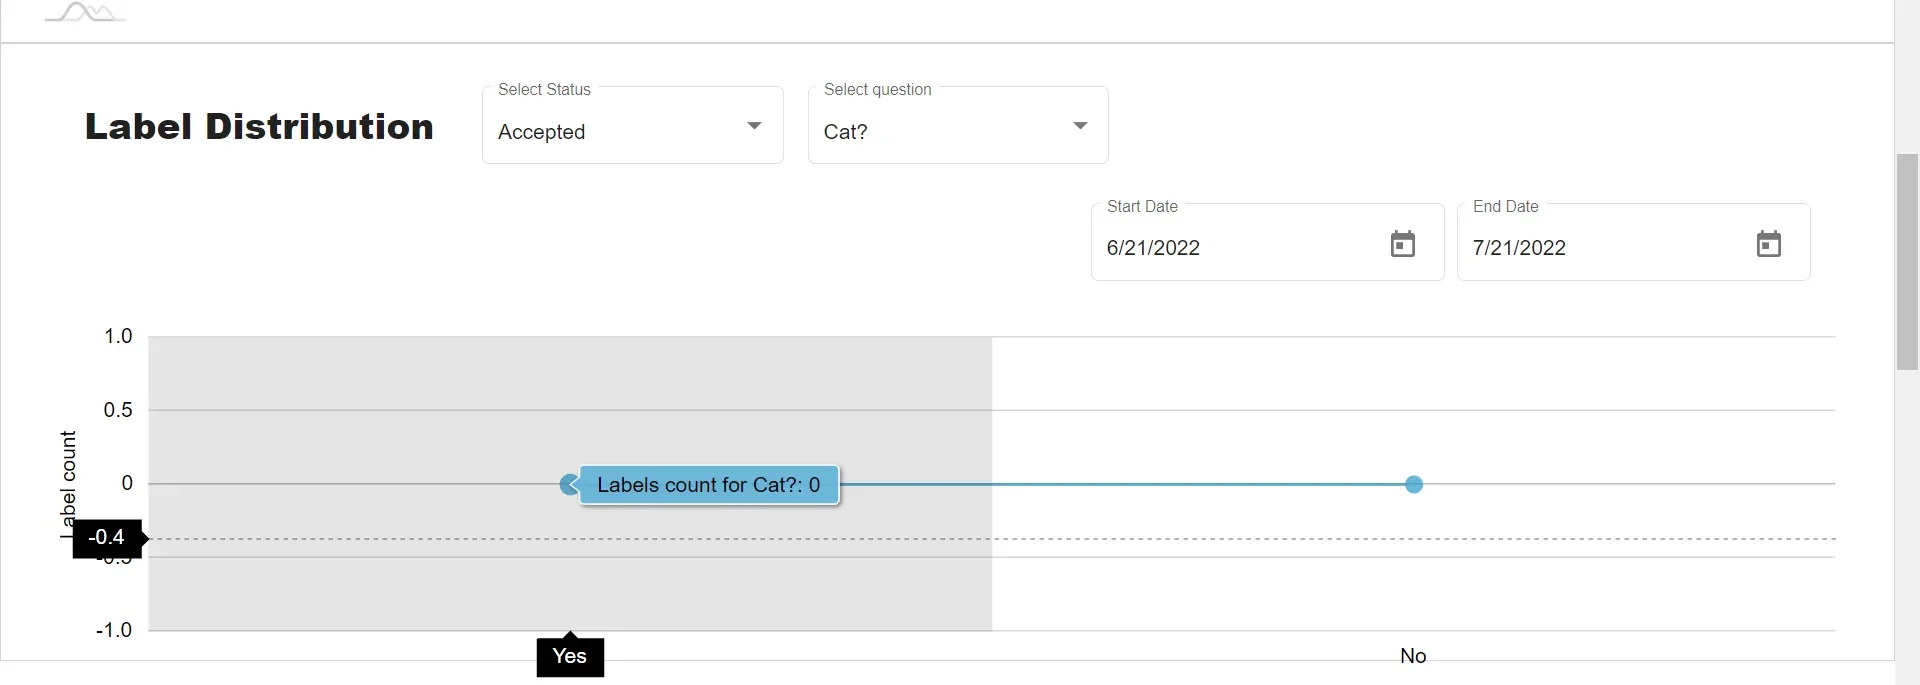
3
User Level Velocity Tracking
User Level Velocity Tracking: It is a graphical representation of average Data annotated and average Working time for a specific annotator.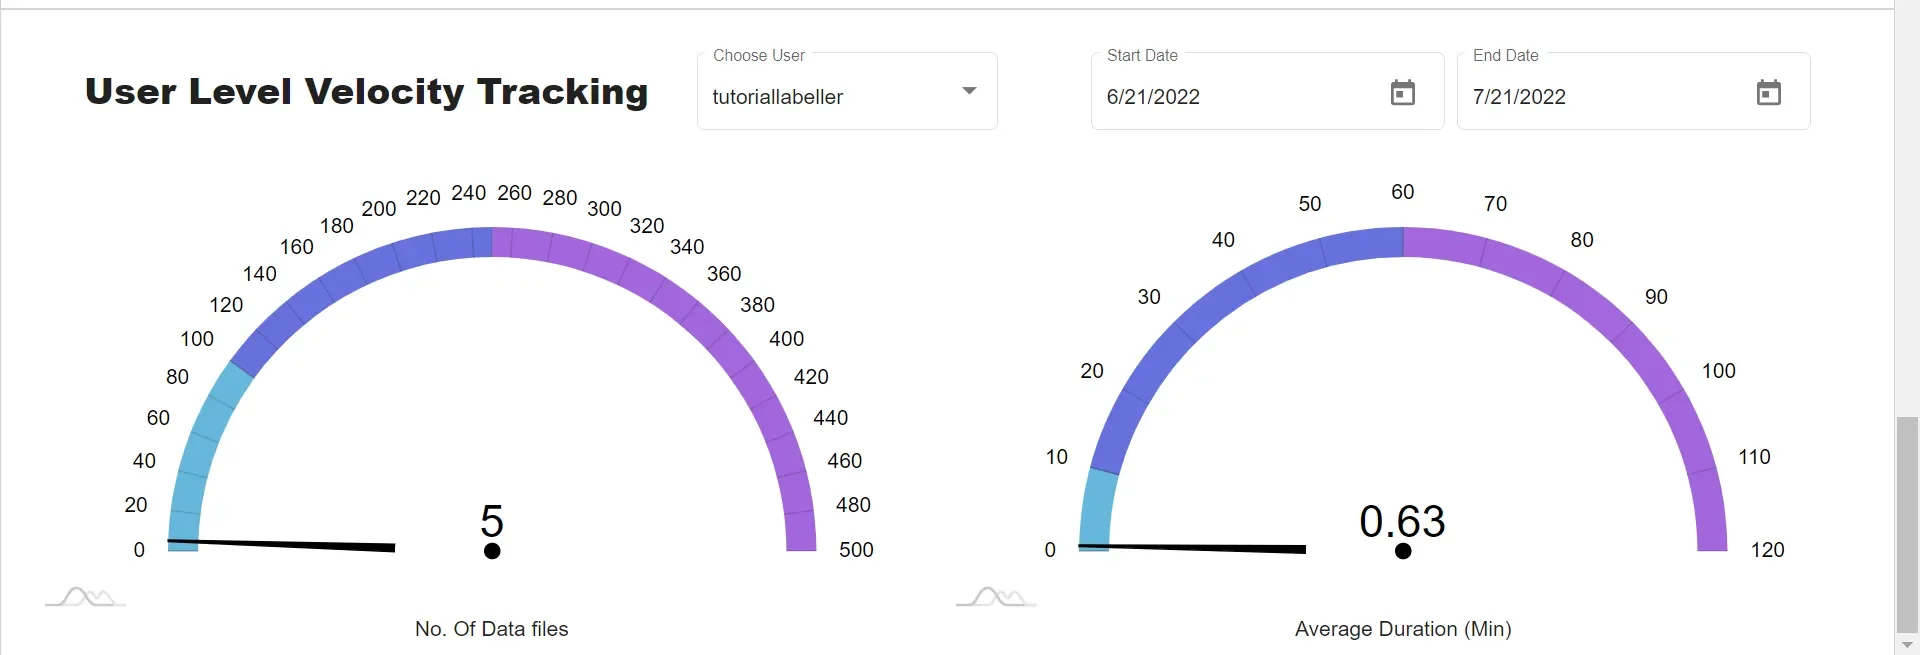
4
User Level Velocity Tracking
User Level Velocity Tracking: It is a graphical representation of average Data annotated and average Working time for a specific annotator.
For further assistance contact support@tensormatics.com